
Titanic: Getting Started With R
So you’re excited to get into prediction and like the look of Kaggle’s excellent getting started competition, Titanic: Machine Learning from Disaster? Great! It’s a wonderful entry-point to machine learning with a manageably small but very interesting dataset with easily understood variables.
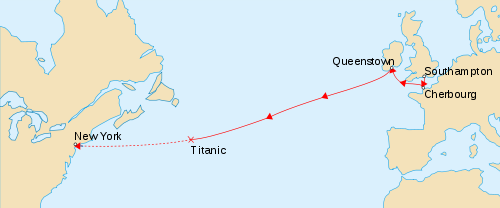
In this competition, you must predict the fate of the passengers aboard the RMS Titanic, which famously sank in the Atlantic ocean during its maiden voyage from the UK to New York City after colliding with an iceberg.
While there could hardly be a more chaotic event than frightened people scrambling to escape a sinking ship, the disaster is famous for saving “women and children first”. With an inadequate number of lifeboats available only a fraction of the passengers survived, and through this series of lessons, we’ll try to predict who they were.
As with most Kaggle competitions, you are given two datasets:
- a training set, complete with the outcome (or target variable) for a group of passengers as well as a collection of other parameters such as their age, gender, etc. This is the dataset on which you must train your predictive model.
- a test set, for which you must predict the now unknown target variable based on the other passenger attributes that are provided for both datasets.
As this is a beginner’s competition, Kaggle has provided a couple of excellent tutorials to get you moving in the right direction, one in Excel, and another using more powerful tools in the Python programming language. Ah, but you would feel (justifiably) embarrassed to use Excel, and Python seems a little heavy right now? Well you’ve come to the right place. I’m going to introduce you to a free and powerful statistical programming language called R and get you started with predictive analytics.
Over the next few weeks I’ll ease you into R and its syntax, piece-by-piece, and step you through a selection of algorithms, from the trivial to the powerful. I’ll also introduce some feature engineering concepts that will start to push the envelope.
In fact, by the time we’re done, you’ll have achieved big gains over the rest of the leaderboard by increasing your accuracy by only a few extra percentage points. That alone is a good lesson for Kaggle: those few points, or even fractions thereof, can translate to massive ranking swings and mean the difference between getting a top 10% badge on your profile (or even getting paid), once you’re ready for the big leagues.
The guide is intended for people with zero experience in R, and probably very little programming experience as well. I won’t get to cover all the syntax, but if you get through the lessons, you may wish to expand your horizons further by checking out some more broad tutorials here and here. Or if you’re more of a book person, this is one that I can recommend highly: The Art of R Programming: A Tour of Statistical Software Design.
If you have any questions about these lessons, I’d encourage you to post them to the Kaggle forums where many others may have already come across the issue before and can jump in to help you out. If you notice any bugs or typos, or have any suggestions on making the tutorial easier to follow, please send me a direct message through Twitter. All code is available on my Github repository.
I will be dividing this series of tutorials into five parts:
- Part 1: Booting Up R
- Part 2: The Gender-Class Model
- Part 3: Decision Trees
- Part 4: Feature Engineering
- Part 5: Random Forests
So go ahead and get started with part 1


Leave a Comment