Kaggle’s Titanic: Getting Started With R - Addendum & Chocolate
One of our MSAN professors, Nick Ross, just loves his trivia. Each time we have our Business Strategies class we get a little dose of fun facts at half-time, and last week we learnt that Milton S. Hershey, the founder of the famous chocolate company, had paid a pretty handsome deposit to board the Titanic with his wife (FWIW, I’m more of a Cadbury guy, being Australian and all… but still, chocolate is chocolate).
As it turned out, he never did board the unsinkable ship and gave up several thousand dollars in today’s money that he paid as a deposit for a plush first class cabin. Given the pretty remarkable coincidence given my recent posts, I thought it might be fun to see what the conditional inference tree model predicted would have happened to him if he had ended up on board.
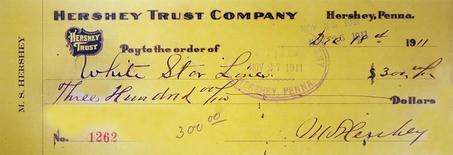
So, what do we know? Well, we have the name “Milton S. Hershey”, or in the dataset’s terms, “Hershey, Mr. Milton S.”. We also know that he booked a first class cabin for himself and his wife and paid a $300 deposit:

Let’s assume that this was a 50% down-payment for two tickets, so $300 could be used for his fare. A little wikipedia tells us he was born on September 13, 1857, which would mean he was 54 years old when the ship left port on April 10, 1912. He was also trying to get from England to the US, so let’s assume that he was sailing from Southampton, though I have been unable to find the exact port he was planning to embark at.
Since we never used the ticket number, or cabin number, for our predictions, we can just leave these as NA values. So let’s build a special Hershey dataframe and combine it to the combi dataframe we built in the tutorial (before we transformed it to build the engineered variables):
> Hershey <- data.frame(Pclass=1, Sex='Male', Age=54, SibSp=1, Parch=0,
                        Fare=300, Embarked='S', PassengerId=NA, Survived=NA,
                        Name='Hershey, Mr. Milton S.', Ticket=NA, Cabin=NA)
> combi <- rbind(train, test, Hershey)
Okay. So now we run through the rest of the tutorial and make our engineered variables, but this time, when we split it back up into the train and test sets, we also break out the Hershey dataset:
> Hershey <- combi[1310,]
We then train our model as before, and finally make our prediction on whether he was a lucky guy or not:
> predict(fit, Hershey, OOB=TRUE, type = "response")
[1] 0
Oh dear! Imagine a world without kisses!
So, sadly, our model tells us that Hershey would have perished in the Titanic disaster. Perhaps you would like to dig into whether some of the other famous people who were almost aboard the famous boat would have escaped or not?


Leave a Comment