Introducing the Kaggle Rank-O-Tron
I had a rare couple of days with not (too) much work this past weekend. I had been sandbagging an idea of visualizing the entire Kaggle leaderboard for some time, instead of just user rankings within a single competition.
I began by scraping the Kaggle community pages using BeautifulSoup in Python, it was good to refresh my HTML scraping and regex skills to get all the data I wanted. Once implemented, this was a fairly trivial exercise and the whole process is completed in around 15 minutes. Unfortunately though, the user tiers (Kaggler, Master) is not encoded in these pages, and I wanted to show where the Kaggle elite stood on the curve as well. So I had to implement a second pass where I visited each user’s profile page and extracted their tier there, this meant visiting thousands of pages which takes over 10 hours to perform.
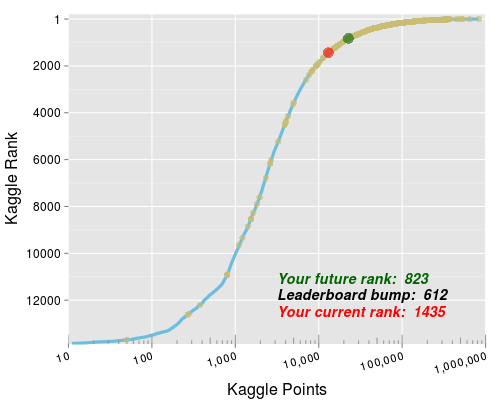
My Data Visualization class led by the talented Sophie Engle has equipped me with a lot of fun new toys to play with, most notably Shiny from RStudio. Thus a mere graph and static blog comment was no longer enough for me. Instead, I decided to make an interactive tool that can show you (approximately) where you will rank in the future given an outcome of a pending competition deadline.
The Kaggle Rank-O-Tron is now live, and is hosted on one of RStudio’s beta servers. You can input your current Kaggle points, and where you expect to finish in your next comp, it will then show you roughly how you will progress.

This is based solely on the equation used by Kaggle to calculate your points. Right now, there is no consideration of several factors that can jostle the users around you. But as I update the database after each competition ends, I’ll try to look for ways to improve the predictions using, well, machine learning of course!
I hope you have some fun with it, but remember, submissions come first!


Leave a Comment