
Box-Plots for Education Recap
I stumbled across a brand new ML competition platform a couple of months ago, DrivenData, which describes itself as hosting “data science competitions to save the world”. Basically think Kaggle for non-profits. They had launched their first prize awarding comp, Box-Plots for Education which aimed to automatically classify education expenses into various categories. I took a look at the data and decided to give it a crack.
The data and problem were rather complex! There were 104 labels to assign, split over 9 different categories. Each one required submitting a probability which made for some massive submission files in excess of 100MB each! As predictors we were given the total cost of an expense, and its full-time fraction if it was for an employee. Additionally there were 14 columns of free-text to play with, mostly being short descriptions of the expense.
To get a feel for how to break down this somewhat intimidating structure, I started with a naive baseline. The provided baseline applied a straight probability to every label. But some labels appeared a lot more than others, so I figured to get moving I would assign each label a probability based on its frequency in the category. This approach got to 1.3913 on the leaderboard, up from the 2.0455 of the provided solution. I was winning! But now to get more serious as I suspected some serious contenders were on their way, and they were…
The first task was to clean up the data. I broke the two numeric columns from all of the text ones first, as I was planning on handling the two types separately. The target columns needed some work too, I re-encoded the targets into two forms, an integer-encoded version that just replaced the text labels with numbers, and a wide format that had 104 columns with one-hot encoding of the individual labels.
There were several different missing value types that I discovered in the data: a true missing value, ie no entry in the CSV; an explicit “n/a” text string; and “(blank)”. I decided that these different types of missings could potentially have different meanings, so created some new columns to tack on to the two existing numeric columns, representing the original text as 0 for present, and (1, 2, 3) for the different missing value types. In the text itself, I replaced all three missing types with the literal string “missing”. For the remaining numeric columns I simply filled the missings with -999.
I had also noticed some of the text was capitalized while others were lower-case. I figured that this may give a clue as to what system had generated it. Some new numeric columns again represented each document as a 0 or 1 for whether it was capitalized or not.
For the raw text, I created 14 bag-of-words corpora for each of the original text columns using scikit-learn’s TfidfVectorizer gathering both uni-grams and bi-grams. This was fit on the training corpus, and then transformed onto the test corpus.
So now I have a dataframe filled with the original Total and FTE numeric data and all my binary engineered features, as well as a bunch of corpora representing the text. How to stitch this mess together?
I decided to apply a LogisticRegression model to each corpus, and then combine my numeric features with the predictions from each of these linear models as features for a second-stage non-linear RandomForestClassifier
Since my model would use two stages, I didn’t want the training set prediction-features to be based on in-sample predictions while the test set would be out-of-sample. So I broke the training data into two folds and ran my logit model over each fold separately to create my training set features, and then ran it again for the full training set to create the test set features. I then applied the Random Forest with a few hundred trees to the new datasets and got a result.
As I had two different forms of my targets, I ran this model in two different ways.
The first couple of models I made treated each label as a separate problem: I trained a set of logit models for each of the 104 target columns… That’s right those of you paying attention… I trained 104 (targets) * 14 (corpora) * 3 (training & test) = 4,368 separate linear models, and also applied 104 (targets) * 3 (CV & test) = 312 Random Forest models to those predictions! This was computationally expensive (understatement of the year) and took one to two days to crunch through all the numbers to get a single prediction file out.
Using this method I made a couple of pretty decent submissions:
- 0.6355 using a L2 parameter of C=0.1, “auto” class weighting, and omitting my engineered features for the forest
- 0.5727 using a L2 parameter of C=10, “auto” class weighting, and pre-filtering the corpora using SelectKBest with the chi-squared statistic to use only the top 95% of the words in each corpus
I also trained a model that treated the problem more as the multi-label classification that it was, while still learning each target category separately. Now I would train the logistic regression to generate a column for each possible label in a category, for each corpus. While the number of linear models was lower with 9 (categories) * 14 (corpora) * 3 (training & test) = 378, the datasets that my Random Forest saw were much larger. This version also did pretty well:
- 0.6433 using a L2 parameter of C=10, “auto” class weighting, and pre-filtering the corpora as before
The big move though was taking a equally weighted blend of my three best models. Taking the output files from each of these, and simply taking the average of the three brought me into fourth place:
- 0.5062 using an average of the three models above
A big gain from blending in this competition! While each model used a very similar representation of the data, the differences in the way I had structured the problem coupled with the fairly big differences in hyper-parameters seemed to make them err in different ways.
I made a couple of tiny gains after that by replacing predictions that identically matched a good number of training-set observations, but the improvements were insufficient to take me to the top 3 in this competition unfortunately. What truly amazed me was how no one moved an inch after closing, the final standings were remarkably stable to the public leaderboard’s indication:
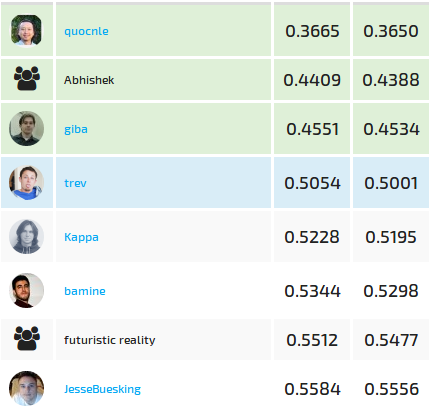
Huge congrats to the winners and really looking forward to the next comp on DrivenData!


Leave a Comment